NIFTY_Weekly_Analysis 06-11-2017 Double bottom – Target 10600 in Nov

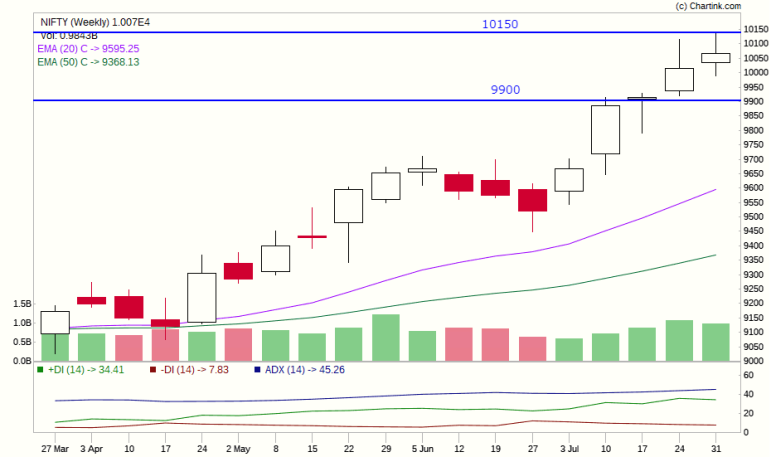
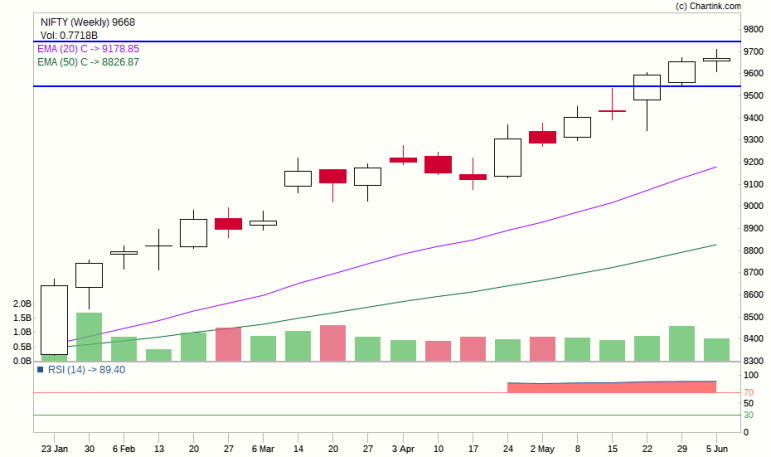
Nifty continues on the bullish run .The same flag pattern which we had uncovered is also a Double bottom pattern but Continuation Double bottom.  Image Courtesy: https://protrader.org/blog/trading-with-reversal-patterns-double-topdouble-bottom-in-the-protrader-platform So based on the pattern we can draw following conclusion: Target The depth is between levels of 10150-9700 so =450 So our logical target based on the pattern … Continue reading NIFTY_Weekly_Analysis 06-11-2017 Double bottom – Target 10600 in Nov

NIFTY_Weekly_Analysis 10-08-2017

NIFTY rebounded back from its bottom of 9700 levels , nicely taking support of 20 EMA. However as suspected NIFTY will remain in a range or sideways trend for the most part of October. The Major bullish trend will be restored on when NIFTY breaks the all time high wall of 10150. For a quick … Continue reading NIFTY_Weekly_Analysis 10-08-2017

NIFTY_Weekly_Analysis 30-09-2017-Korean missiles and Economic Data

NIFTY Has taken a support at the 9700-9750 zone after the blood bath this week. Korean Missile Crisis NIFTY's fall had more nuclear fuel added to it with Economic Data & weak Earnings Report being released. The economy has slowed down at the markets have reacted .However, in a bull market all corrections tend to … Continue reading NIFTY_Weekly_Analysis 30-09-2017-Korean missiles and Economic Data

NIFTY_Weekly_Analysis 27-08-2017-Solid Pin/Doji Hammer Buy : Above 9900 Target 1 : 10070 (Next Resistance)  Target 2: 10150 Stop loss :9800 , 9750

NIFTY Shows a Quick recovery bounce and formes a Classic Reversal pattern on Doji Hammer- this  is  Bullish Reversal By the book ! The Doji hammer follows the classic Ratio of being more than 1:5 tail to Head ratio . This hammer has formed during the strong Run in  Nifty up Channel The same structure … Continue reading NIFTY_Weekly_Analysis 27-08-2017-Solid Pin/Doji Hammer Buy : Above 9900 Target 1 : 10070 (Next Resistance)  Target 2: 10150 Stop loss :9800 , 9750

NIFTY_Weekly_Analysis 18-08-2017 – Sudden Exit of Vishal Sikka spoils the Bounce back

NIFTY bounced from the 9700 and made an attempt to shrug off the losses . However Mr Vishal Sikkas Exit from Infosys has spoiled the sentiment again. NIFTY has Formed an upside down hammer but it barely meets the Criteria fro a Strong Bearish Hammer . So the Sentiment is still nowhereness . This Structure … Continue reading NIFTY_Weekly_Analysis 18-08-2017 – Sudden Exit of Vishal Sikka spoils the Bounce back

NIFTY_Weekly_Analysis 12-08-2017 Markets Flash Sale- NIFTY 9700

Nifty came Crashing from Mount 10,100 - The profit booking as expected initiated the the down turn ,followed by the news of 331 shell companies being given notice by SEBI ( makes no sense ) but the last blow - The tensions between US and Korea made the index come down HARD at the 9700! Which further makes no sense unless we are at … Continue reading NIFTY_Weekly_Analysis 12-08-2017 Markets Flash Sale- NIFTY 9700

NIFTY_Weekly_Analysis 30-07-2017 Mount 10,000 has been breached !

NIfty Finally broke ahead of the legendary 10,000 level thank to Bihar coalition news  Sensex, Nifty reach all-time highs amid Bihar CM's surprise move, strong Q1 earnings As mentioned before due to profit booking max it came down . Read it here We see a shooting star candlestick pattern  which has indicated that NIFTY may … Continue reading NIFTY_Weekly_Analysis 30-07-2017 Mount 10,000 has been breached !

NIFTY Weekly Analysis 11-06-2017-Doji/spinning -may go anywhere

  NIFTY has formed a spinning -top / doji like candle pattern. this Depicts indecision so for the short term market may go any direction . Looking at the strong uptrend and 9700 as strong resistance we expect bias towards bearishness. NIFTY  likely to fall between the range of 9400-9300 Fresh buying can be done … Continue reading NIFTY Weekly Analysis 11-06-2017-Doji/spinning -may go anywhere